
XG Firewall
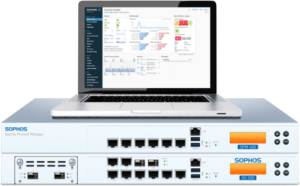
Sophos XG Firewall provides unprecedented visibility into your network, users, and applications right from the all-new control center. You also get rich, on-box reporting and the option to add Sophos Firewall Manager and iView for centralized management and reporting across multiple firewalls.
SYSTEMS PANEL
View the real-time status of your system performance, services, connections, and other system parameters. The panel also provides helpful system and network tools you can use for troubleshooting purposes such as ping, traceroute, packet capture, command-line access, and much more.
REPORTS
This panel displays the top five reports that may have data of interest or that require action based on automatic background analysis. Examples include high-risk applications, objectionable websites, web users, intrusion attacks, web server attacks, and more.
TRAFFIC INSIGHT
This provides an overview of traffic processed in the last 24 hours, including web activity, allowed and blocked apps, and web categories, as well as network attacks.
NAVIGATION
SECURITY HEARTBEAT
The Sophos Security Heartbeat™ indicates the health status of all your Sophos Cloud managed endpoints.